Difference between revisions of "USRP"
(→LO XO) |
(→Get one) |
||
| (5 intermediate revisions by the same user not shown) | |||
| Line 1: | Line 1: | ||
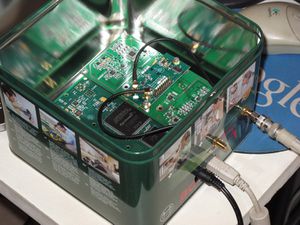
| + | [[File:USRP_Custom_Case.jpg|thumb|USRP in a 'custom case']] | ||
| + | |||
== Get one == | == Get one == | ||
From [http://www.ettus.com/products Ettus Research]. | From [http://www.ettus.com/products Ettus Research]. | ||
| + | |||
| + | If you're after some software to use this hardware, check out the [[USRP Interfaces]]. | ||
Much of what is at the bottom in the [[RF]] wiki table has been done with a USRP 1 and WBX daughterboard. | Much of what is at the bottom in the [[RF]] wiki table has been done with a USRP 1 and WBX daughterboard. | ||
| Line 46: | Line 50: | ||
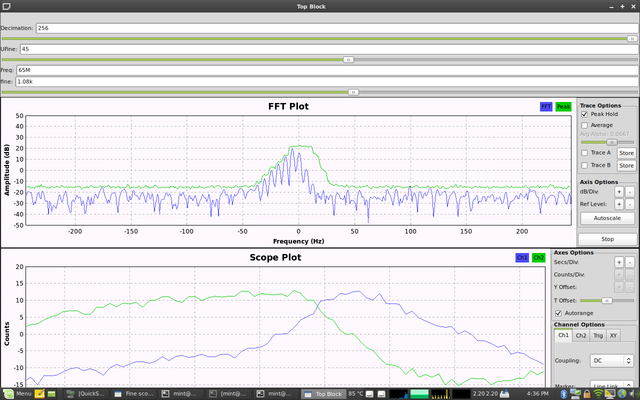
XO drift is shown by flat top of the green Peak Hold line. This visualises the 'max' of the peak that slowly moves left and right as the XO changes frequency (12 PPM). From this, one can deduce the oscillator (in-)stability. | XO drift is shown by flat top of the green Peak Hold line. This visualises the 'max' of the peak that slowly moves left and right as the XO changes frequency (12 PPM). From this, one can deduce the oscillator (in-)stability. | ||
| − | The references is a pure sine wave @ 65MHz generated by | + | The references is a pure sine wave @ 65MHz generated by the classic [http://www.eham.net/reviews/detail/6037 HP-8640B]. |
Notice that the width of the spectrum in the FFT Plot is very, very narrow, and the period of the I/Q waves in the Scope Plot indicate a very large period. | Notice that the width of the spectrum in the FFT Plot is very, very narrow, and the period of the I/Q waves in the Scope Plot indicate a very large period. | ||
| Line 58: | Line 62: | ||
== Auto-correlation artifacts == | == Auto-correlation artifacts == | ||
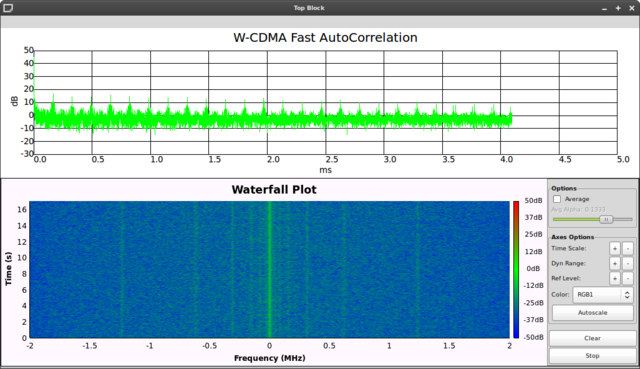
| − | Running an auto-correlation on the input from a WBX with the [http://gallery.spench.net/v/RF/Safe.jpg.html receiving antenna connector terminated] yields the following peaks: | + | Running an [[Fast Auto-correlation|auto-correlation]] on the input from a WBX with the [http://gallery.spench.net/v/RF/Safe.jpg.html receiving antenna connector terminated] yields the following peaks: |
[[File:USRP_FAC_Noise.png|640px]] | [[File:USRP_FAC_Noise.png|640px]] | ||
{{RF}} | {{RF}} | ||
Latest revision as of 10:18, 12 November 2011
Get one
From Ettus Research.
If you're after some software to use this hardware, check out the USRP Interfaces.
Much of what is at the bottom in the RF wiki table has been done with a USRP 1 and WBX daughterboard.
Current Draw
| State | Consumption (mA) |
|---|---|
| Initial power-on | 670 |
| Post-flash | 1040 |
| Post-tune | 1080 |
| Streaming | 1165 |
| Software release | 265 |
- Cigarette lighter double adapter draws 20mA @ 12.0V, 32mA @ 13.2V
WBX Sensitivity
Tested with HP 8640B with AM modulation of music, audio demodulation by Winrad, and human 'can just hear it' response:
| Frequency (MHz) | Connection | HP Output Level |
|---|---|---|
| 74.202 | Directly to HP | -110dBm |
| 14.202 | Via +60MHz transverter | -110dBm + half turn of dial |
- HP power output dial turns a fraction over three-quarters of a revolution (between coarse output level and next strongest level up).
- For AM with constant tone through transverter, only quarter turn of dial is required.
LO XO
XO drift is shown by flat top of the green Peak Hold line. This visualises the 'max' of the peak that slowly moves left and right as the XO changes frequency (12 PPM). From this, one can deduce the oscillator (in-)stability.
The references is a pure sine wave @ 65MHz generated by the classic HP-8640B.
Notice that the width of the spectrum in the FFT Plot is very, very narrow, and the period of the I/Q waves in the Scope Plot indicate a very large period.
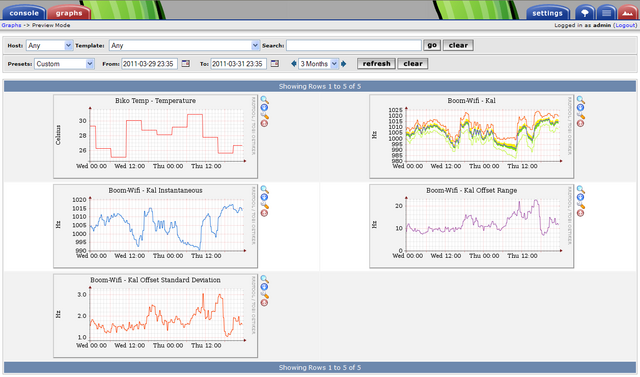
Kal was SNMP-enabled, and results were graphed relative to ambient temperature using Cacti:
Auto-correlation artifacts
Running an auto-correlation on the input from a WBX with the receiving antenna connector terminated yields the following peaks:
| ||||||||||||||||||||||||||||||||||||||||||||||||||||||||||||||||


