RADAR
From SpenchWiki
Contents
[hide]DFS with ath5k
- With a view to Dynamic Frequency Selection powered by RADAR PHY errors reported to the driver.
Visualisation of RADAR activity
- Patched ath5k driver reports PHY error details to userspace via debugfs.
- Python daemon on Linux collects details, sweeps frequency ranges on-demand, and reports details to any connected client over the network.
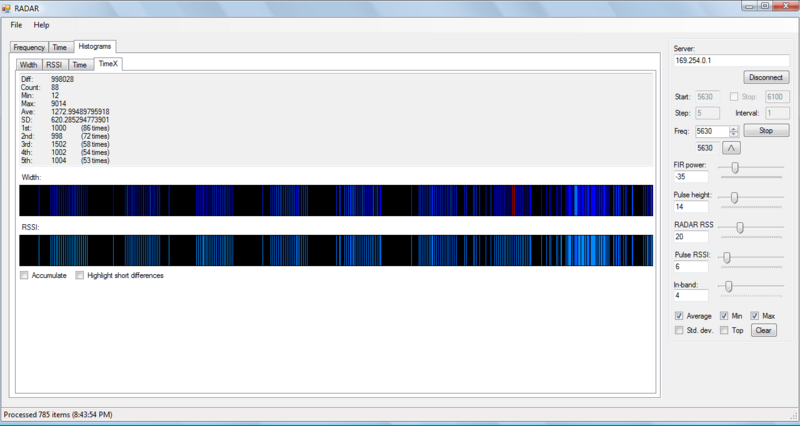
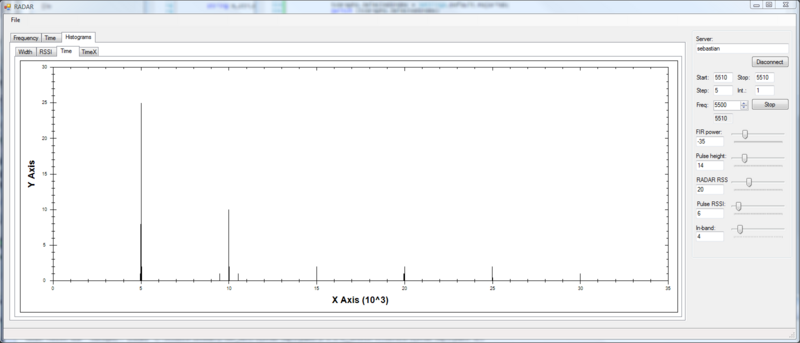
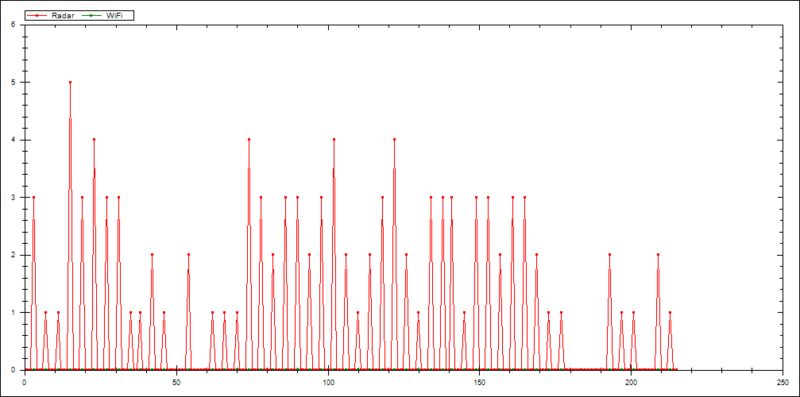
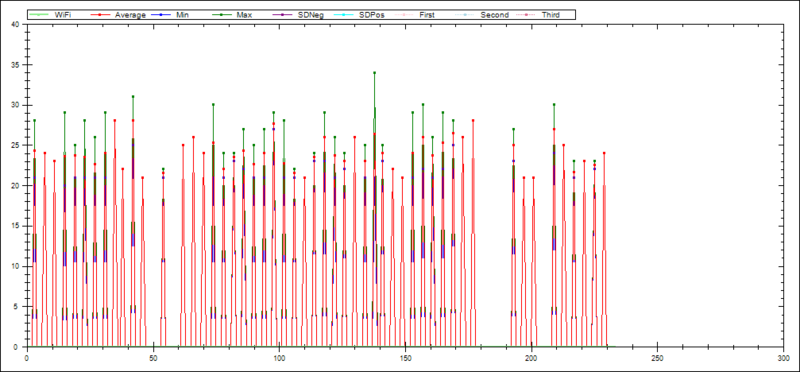
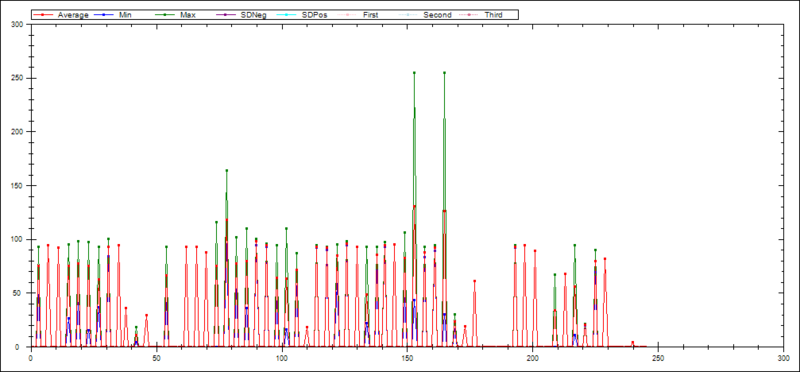
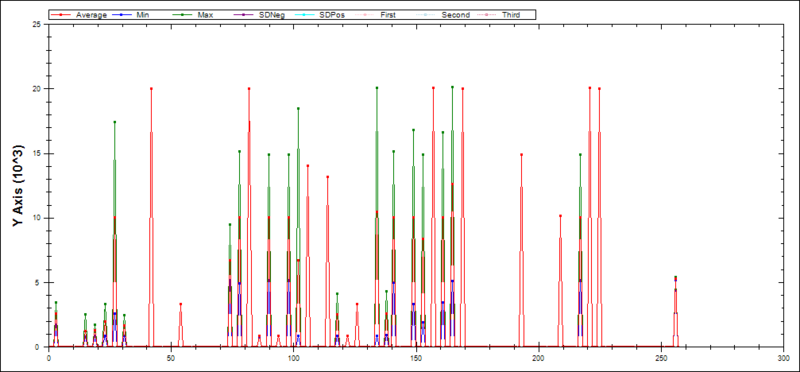
- .NET GUI visualises legitimate WiFi packets and RADAR errors over frequency/time, plots histograms of pulse width, RSSI distribution, time between pulses, and draws time-series graphic to help uncover repetition rate within a sample of pulses.
Spectrum Sweep
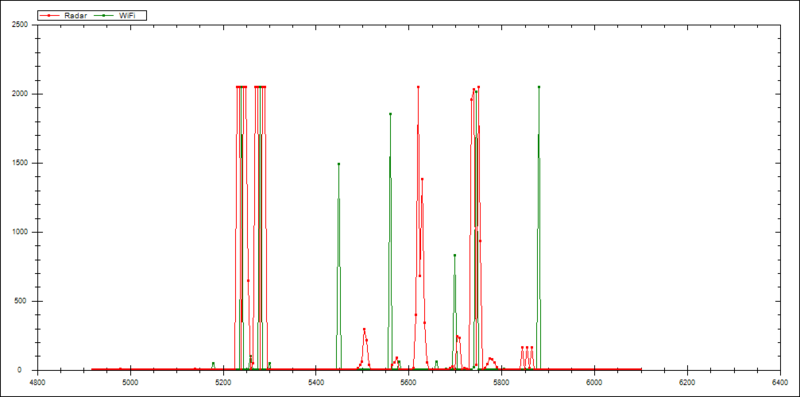
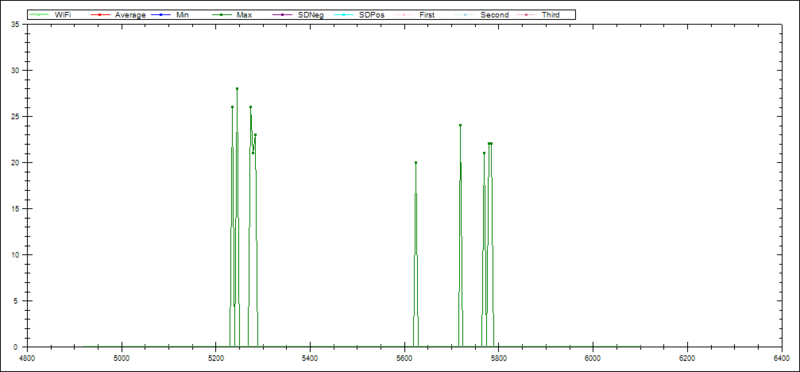
20MHz channel width
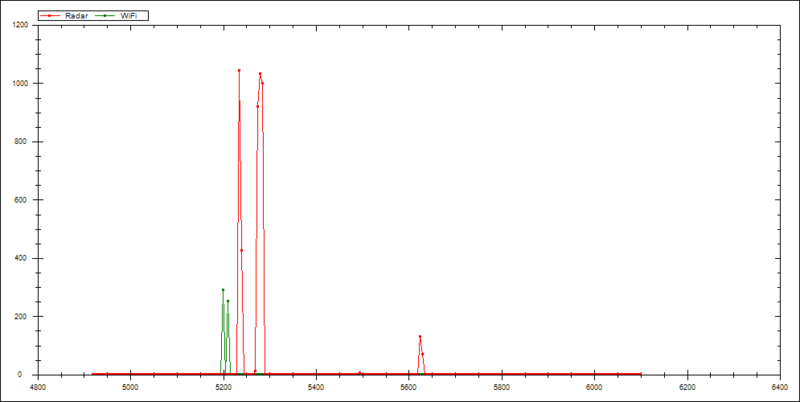
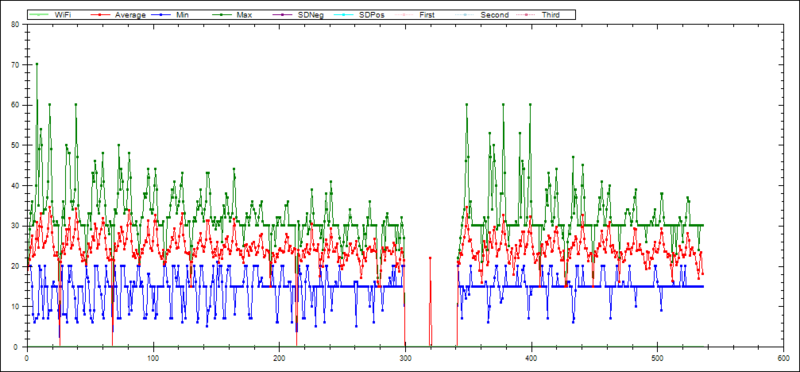
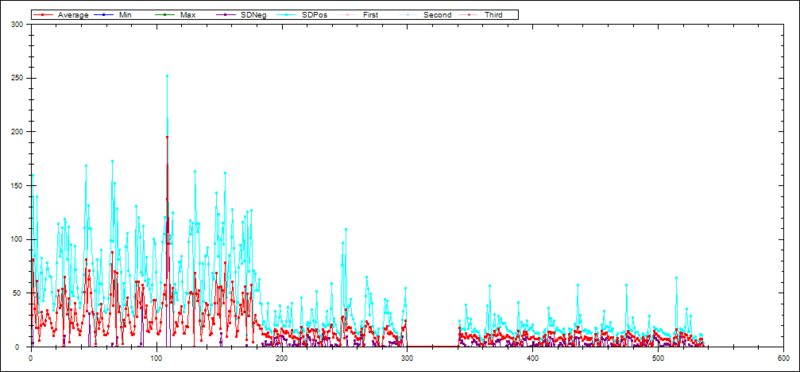
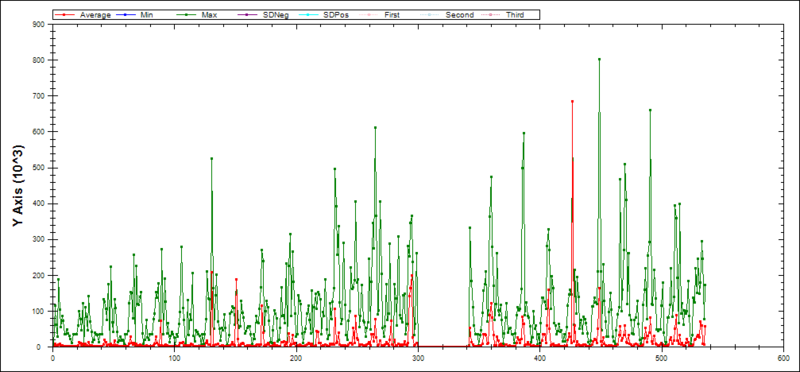
- Notice how RADAR errors are reported either side of a legitimate WiFi channel:
10MHz channel width
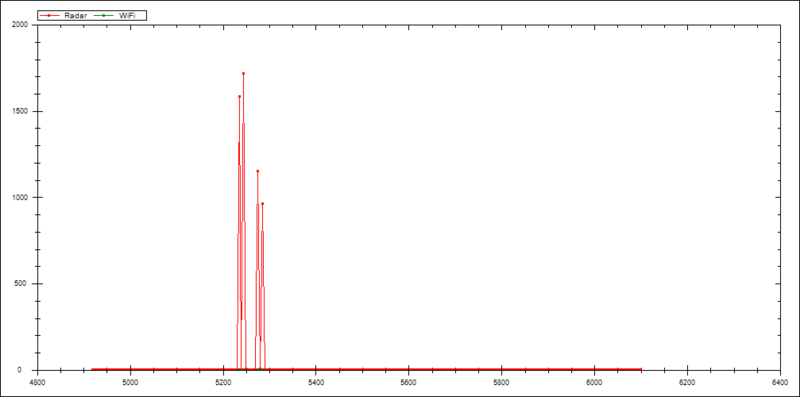
- No WiFi operating at this channel width:
5MHz channel width
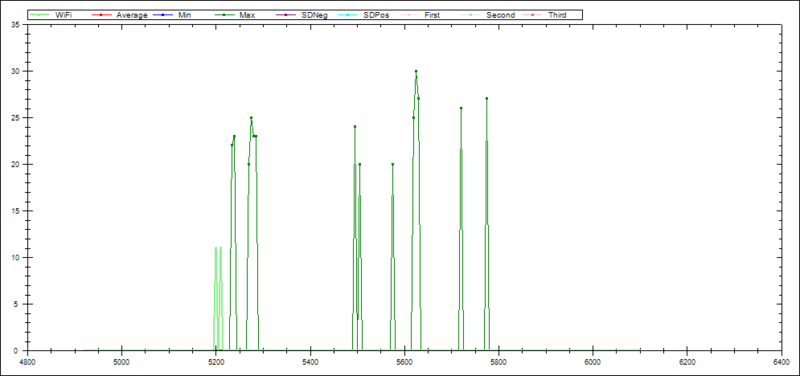
- Some WiFi operating at this narrow channel width:
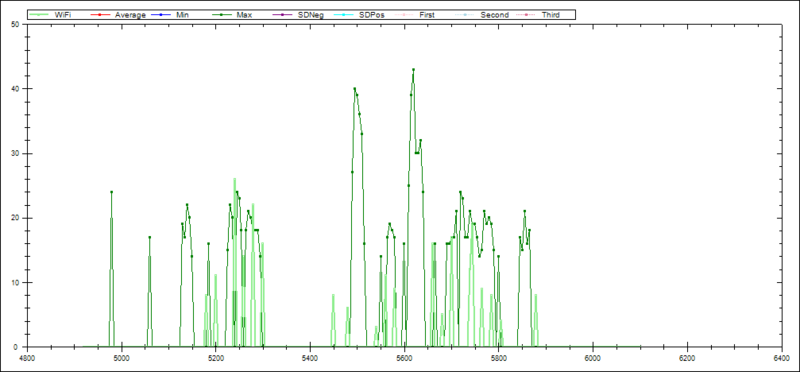
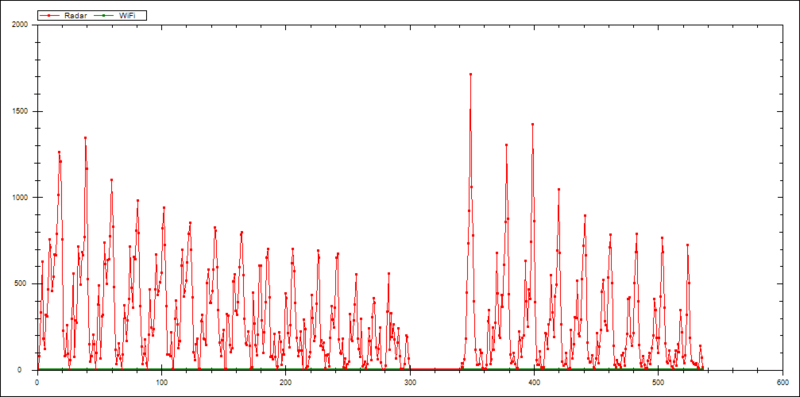
Kurnell Weather RADAR
- 5500/5600MHz
- 1kHz PRF:
- 5kHz PRF:
5800MHz
- DECT nearby?
