USRP
From SpenchWiki
LO XO
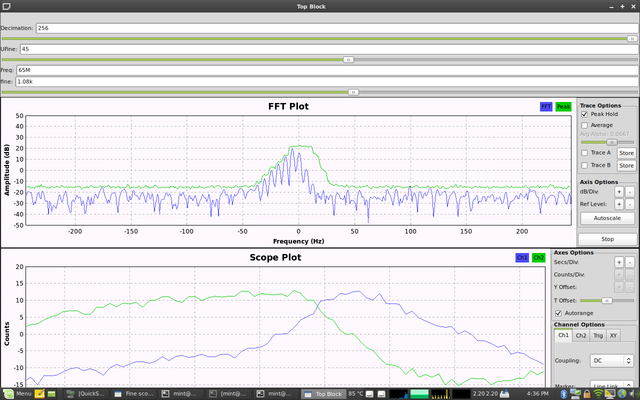
XO drift is shown by flat top of the green Peak Hold line. This visualises the 'max' of the peak that slowly moves left and right as the XO changes frequency (12 PPM). From this, one can deduce the oscillator (in-)stability.
The references is a pure since wave @ 65MHz generated by an HP-8640B.
Notice that the width of the spectrum in the FFT Plot is very, very narrow, and the period of the I/Q waves in the Scope Plot indicate a very large period.
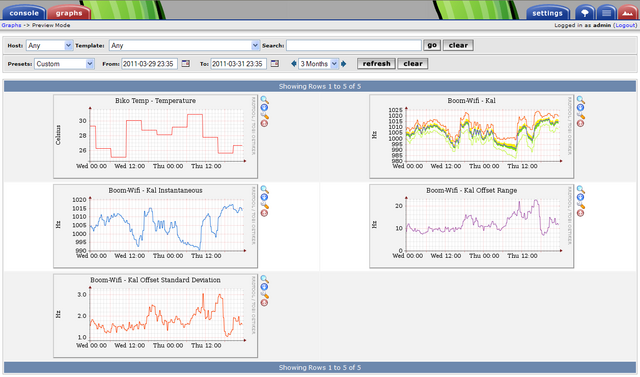
Kal was SNMP-enabled, and results were graphed relative to ambient temperature using Cacti:

