Difference between revisions of "RADAR"
From SpenchWiki
| Line 37: | Line 37: | ||
* 5500/5600MHz | * 5500/5600MHz | ||
| + | |||
| + | * One can infer the rotation rate of the RADAR by examining the difference in time, especially in the 'Counts' (number of reported RADAR PHY errors) over time: | ||
[[File:RADAR_ath5k_Kurnell_TimeCount.png|800px|thumb|center|Counts vs. Time]] | [[File:RADAR_ath5k_Kurnell_TimeCount.png|800px|thumb|center|Counts vs. Time]] | ||
| + | |||
| + | * Average RSSI decreases a little in each 'transmission section' (separated by the pause in-between), however decrease is most noticable in the maximum value per sample-group: | ||
| + | |||
[[File:RADAR_ath5k_Kurnell_TimeRSSI.png|800px|thumb|center|RSSI vs. Time]] | [[File:RADAR_ath5k_Kurnell_TimeRSSI.png|800px|thumb|center|RSSI vs. Time]] | ||
| + | |||
| + | * Not sure why the distribution of widths changes later (was this when my laptop was knocked off its perch by the wind?!): | ||
| + | |||
[[File:RADAR_ath5k_Kurnell_TimeWidth.png|800px|thumb|center|Pulse width vs. Time]] | [[File:RADAR_ath5k_Kurnell_TimeWidth.png|800px|thumb|center|Pulse width vs. Time]] | ||
| + | |||
| + | * Whatever the change above, it is also reflected here: | ||
| + | |||
[[File:RADAR_ath5k_Kurnell_TimeTime.png|800px|thumb|center|Time between pulses vs. Time]] | [[File:RADAR_ath5k_Kurnell_TimeTime.png|800px|thumb|center|Time between pulses vs. Time]] | ||
| − | * 1kHz PRF: | + | * 1kHz PRF |
| + | ** You can see that the five highest bins (which hold counts for the distinct times between detected RADAR pulses) have values of ~1000. The time-series plot shows the regular repetition: | ||
[[File:RADAR_ath5k_Kurnell_PRF1000.png|800px|thumb|center|Time-series plot of pulses]] | [[File:RADAR_ath5k_Kurnell_PRF1000.png|800px|thumb|center|Time-series plot of pulses]] | ||
| − | * 5kHz PRF: | + | * 5kHz PRF |
| + | ** As above, however this time it's ~5000: | ||
[[File:RADAR_ath5k_Kurnell_PRF5000.png|800px|thumb|center|Time-series plot of pulses]] | [[File:RADAR_ath5k_Kurnell_PRF5000.png|800px|thumb|center|Time-series plot of pulses]] | ||
| + | |||
| + | * This is also reflected in the time-between-pulses histogram: | ||
| + | |||
[[File:RADAR_ath5k_Kurnell_HistoTime5000.png|800px|thumb|center|Histogram of time between pulses]] | [[File:RADAR_ath5k_Kurnell_HistoTime5000.png|800px|thumb|center|Histogram of time between pulses]] | ||
| − | === | + | === ISM === |
| − | * DECT nearby? | + | * Indoors, the sweep looks quite different: |
| + | *** Notice the significant response at 5800MHz. Could this be DECT nearby? | ||
[[File:RADAR_ath5k_Room_RSSI.png|800px|thumb|center|RSSI vs. Frequency]] | [[File:RADAR_ath5k_Room_RSSI.png|800px|thumb|center|RSSI vs. Frequency]] | ||
| + | |||
| + | * Examing the time-series plot of RSSI clearly shows a regular, repeating group of pulses (not as apparent due to the colouring on the width plot as the pulse widths seem to be changing moreso, however the time-between pulses is identical): | ||
| + | |||
[[File:RADAR_ath5k_Room_PRF.png|800px|thumb|center|Time-series plot of pulses]] | [[File:RADAR_ath5k_Room_PRF.png|800px|thumb|center|Time-series plot of pulses]] | ||
=== 5140MHz === | === 5140MHz === | ||
| + | |||
| + | * No idea what this is, however it appears rather regular (also note the regular pauses between groups of RADAR errors): | ||
[[File:RADAR_ath5k_5140_TimeCount.png|800px|thumb|center|Counts vs. Time]] | [[File:RADAR_ath5k_5140_TimeCount.png|800px|thumb|center|Counts vs. Time]] | ||
Revision as of 11:43, 23 January 2012
Contents
[hide]DFS with ath5k
- With a view to Dynamic Frequency Selection powered by RADAR PHY errors reported to the driver.
Visualisation of RADAR activity
- Patched ath5k driver reports PHY error details to userspace via debugfs.
- Python daemon on Linux collects details, sweeps frequency ranges on-demand, and reports details to any connected client over the network.
- .NET GUI visualises legitimate WiFi packets and RADAR errors over frequency/time, plots histograms of pulse width, RSSI distribution, time between pulses, and draws time-series graphic to help uncover repetition rate within a sample of pulses.
Spectrum Sweep
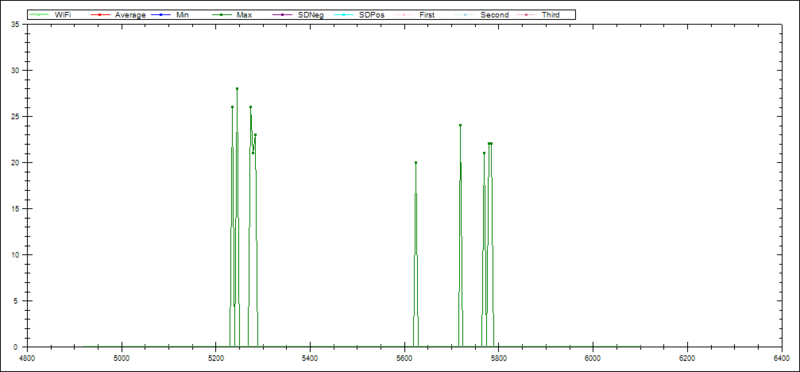
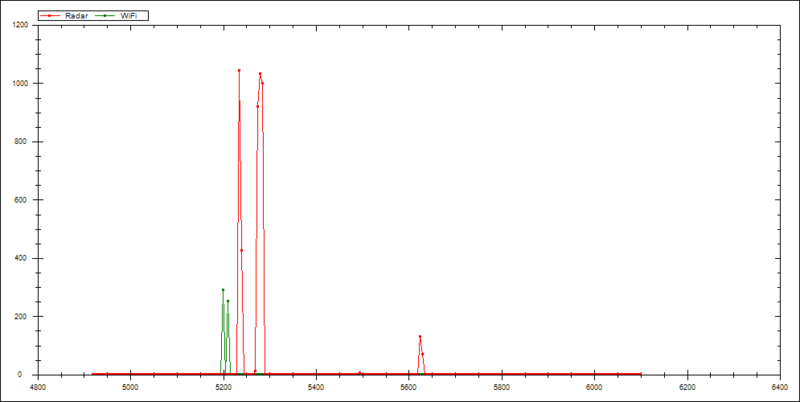
20MHz channel width
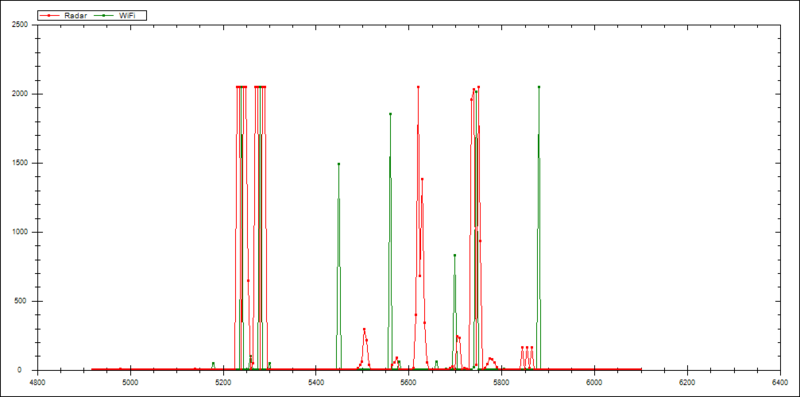
- Notice how RADAR errors are reported either side of a legitimate WiFi channel:
10MHz channel width
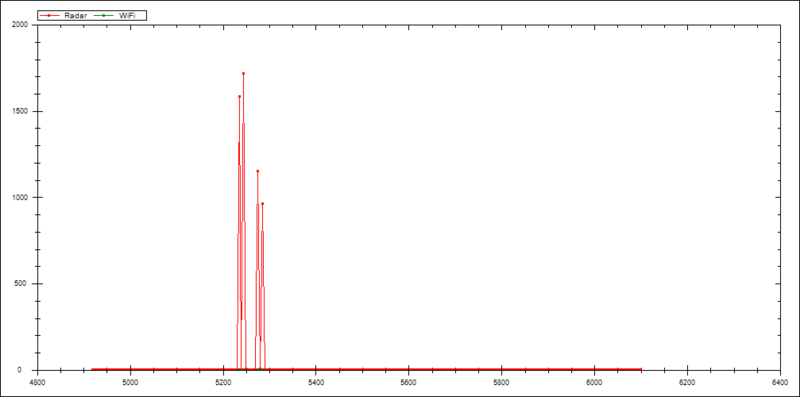
- No WiFi operating at this channel width:
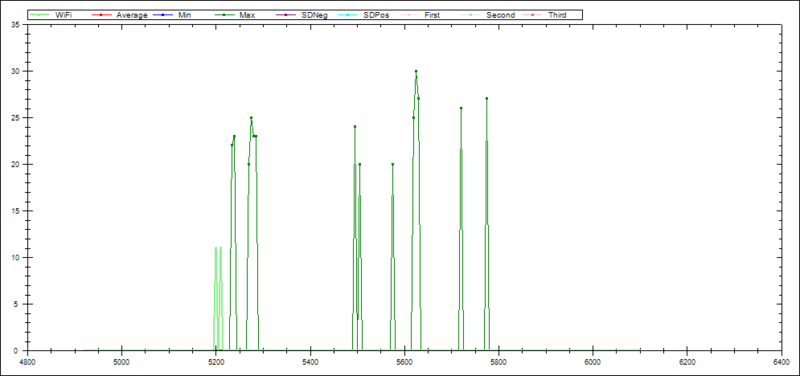
5MHz channel width
- Some WiFi operating at this narrow channel width:
Kurnell Weather RADAR
- 5500/5600MHz
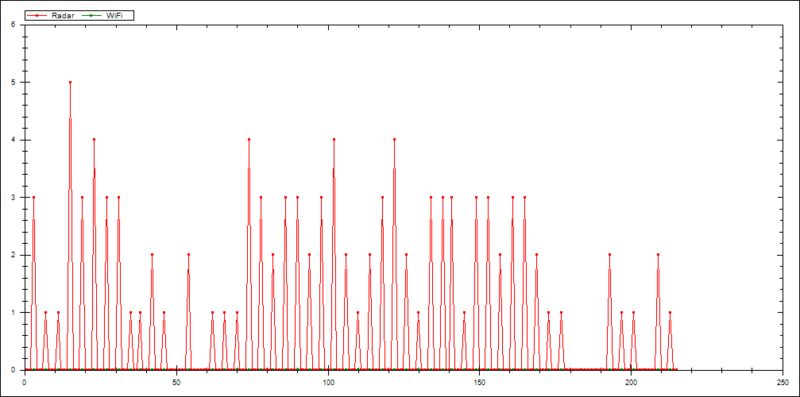
- One can infer the rotation rate of the RADAR by examining the difference in time, especially in the 'Counts' (number of reported RADAR PHY errors) over time:
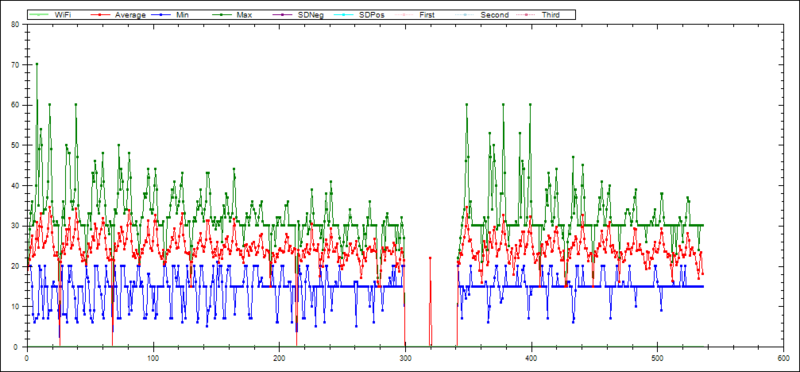
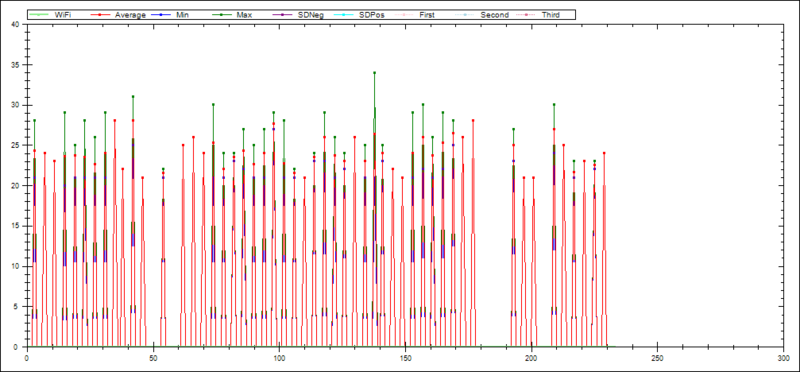
- Average RSSI decreases a little in each 'transmission section' (separated by the pause in-between), however decrease is most noticable in the maximum value per sample-group:
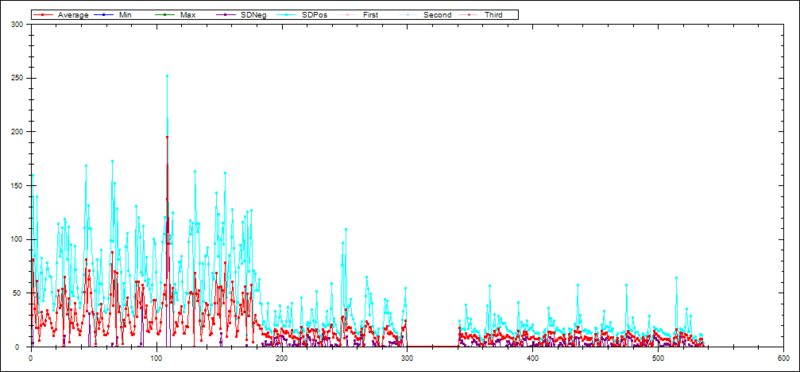
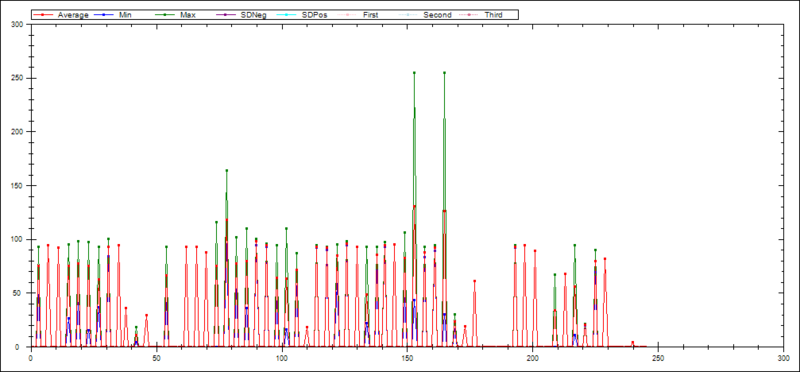
- Not sure why the distribution of widths changes later (was this when my laptop was knocked off its perch by the wind?!):
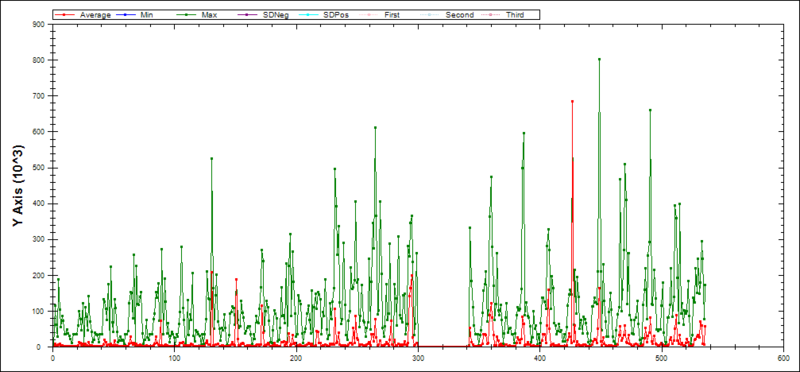
- Whatever the change above, it is also reflected here:
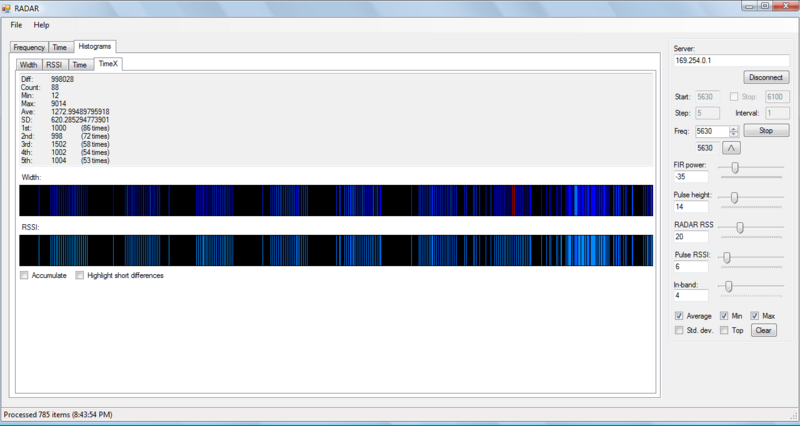
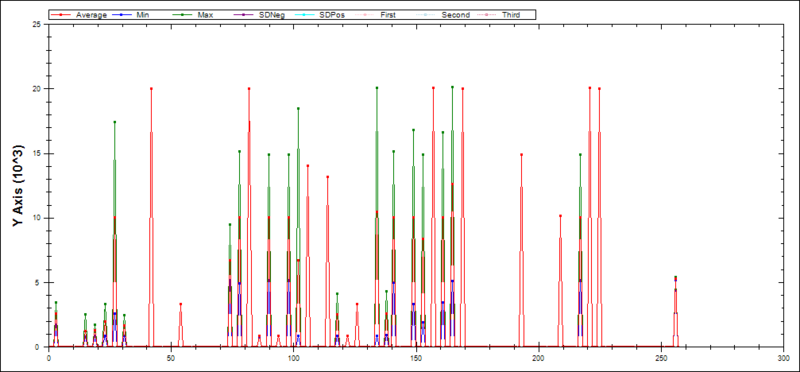
- 1kHz PRF
- You can see that the five highest bins (which hold counts for the distinct times between detected RADAR pulses) have values of ~1000. The time-series plot shows the regular repetition:
- 5kHz PRF
- As above, however this time it's ~5000:
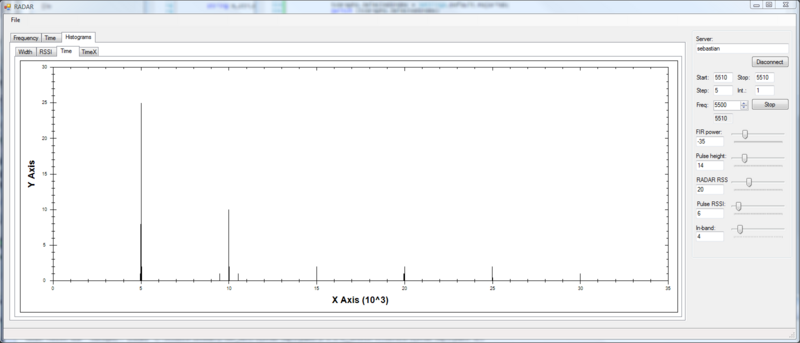
- This is also reflected in the time-between-pulses histogram:
ISM
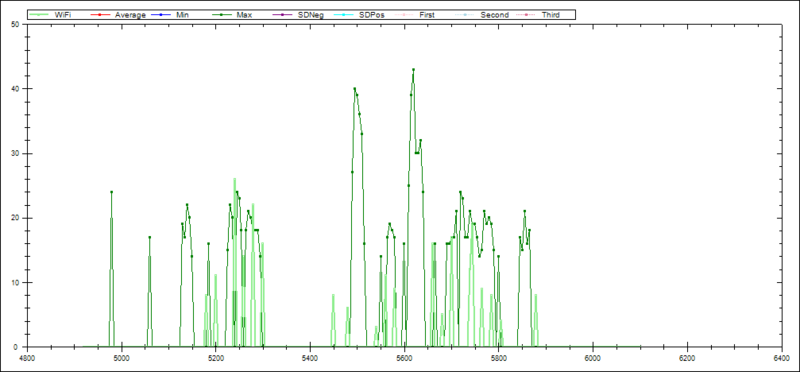
- Indoors, the sweep looks quite different:
- Notice the significant response at 5800MHz. Could this be DECT nearby?
- Examing the time-series plot of RSSI clearly shows a regular, repeating group of pulses (not as apparent due to the colouring on the width plot as the pulse widths seem to be changing moreso, however the time-between pulses is identical):
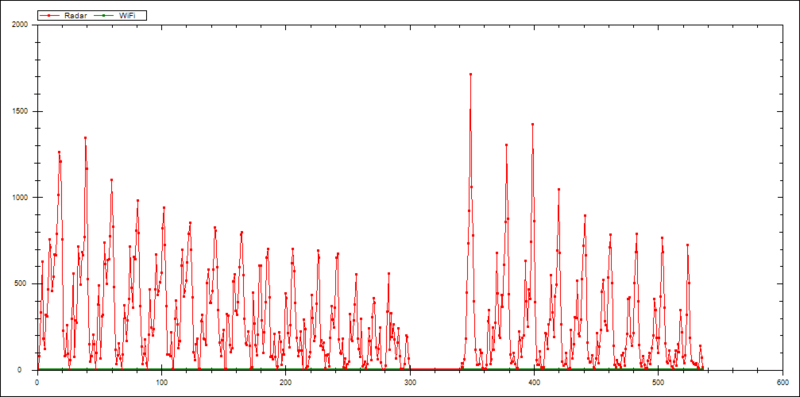
5140MHz
- No idea what this is, however it appears rather regular (also note the regular pauses between groups of RADAR errors):
