Difference between revisions of "W-CDMA"
From SpenchWiki
(Created page with '== Specs == W-CDMA is used by the UMTS. {| class="wikitable" border="1" |+ UMTS's Magic Numbers |- ! Property || Value |- | Modulation/Access scheme || W-CDMA |- | Channel band...') |
|||
| Line 1: | Line 1: | ||
== Specs == | == Specs == | ||
| − | W-CDMA is used by the UMTS. | + | [http://en.wikipedia.org/wiki/W-CDMA W-CDMA] is used by the [http://en.wikipedia.org/wiki/Universal_Mobile_Telecommunications_System UMTS]. |
{| class="wikitable" border="1" | {| class="wikitable" border="1" | ||
| Line 25: | Line 25: | ||
== References == | == References == | ||
| − | * WCDMA | + | * A great [http://www.privateline.com/3G/WCDMA.pdf PDF] that deals with many technical aspects of the air interface. |
== Auto-correlation == | == Auto-correlation == | ||
| Line 32: | Line 32: | ||
[[File:W-CDMA_FAC.png|800px]] | [[File:W-CDMA_FAC.png|800px]] | ||
| + | |||
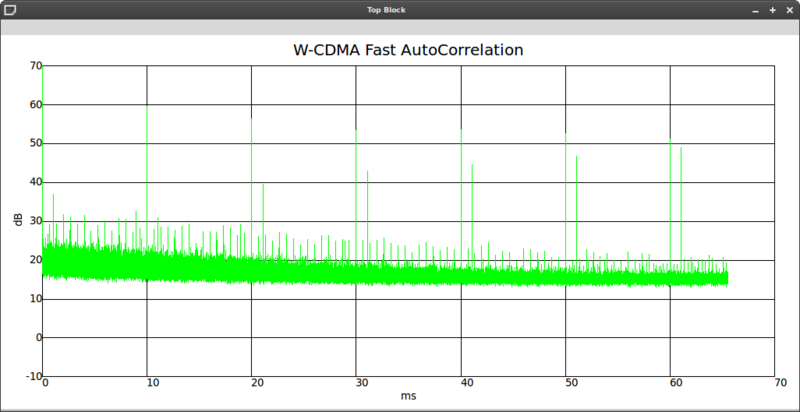
| + | Strong peaks precisely on the 10ms grid line are indicative of the pilot channel. | ||
| + | |||
| + | There is also a smaller peak at ~0.7ms, which should be the repeating slot of the pilot channel. | ||
* Telstra NextG at 842.5MHz: | * Telstra NextG at 842.5MHz: | ||
| Line 37: | Line 41: | ||
[[File:NextG_FAC.png|800px]] | [[File:NextG_FAC.png|800px]] | ||
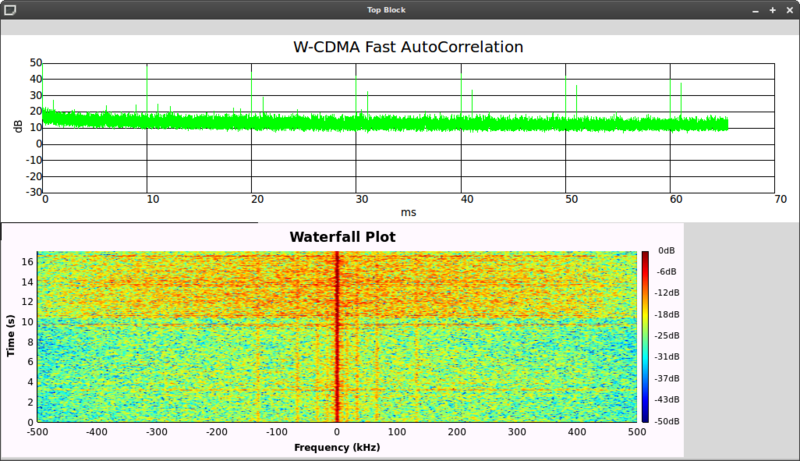
| − | + | Waterfall plot shows bursty traffic on the downlink. This would likely contribute to the correlation graph looking more 'noisy' about the pilot channel peaks. | |
Revision as of 21:09, 18 July 2011
Specs
| Property | Value |
|---|---|
| Modulation/Access scheme | W-CDMA |
| Channel bandwidth | 5MHz |
| Chip rate | 3.84MHz |
| Common pilot channel (CPICH) | Fixed-rate 30 Kbps, spreading factor (SF) 256 |
| Primary CPICH (CCPCH) | 14 slots in one radio frame |
| CCPCH slot | First 256 chips Tx OFF, then 18 data bits (20 bits/2560 chips in total) |
| CCPCH frame | 10ms total duration |
References
- A great PDF that deals with many technical aspects of the air interface.
Auto-correlation
- 3G UMTS at 2.1125GHz:
Strong peaks precisely on the 10ms grid line are indicative of the pilot channel.
There is also a smaller peak at ~0.7ms, which should be the repeating slot of the pilot channel.
- Telstra NextG at 842.5MHz:
Waterfall plot shows bursty traffic on the downlink. This would likely contribute to the correlation graph looking more 'noisy' about the pilot channel peaks.

